2018 Annual Report

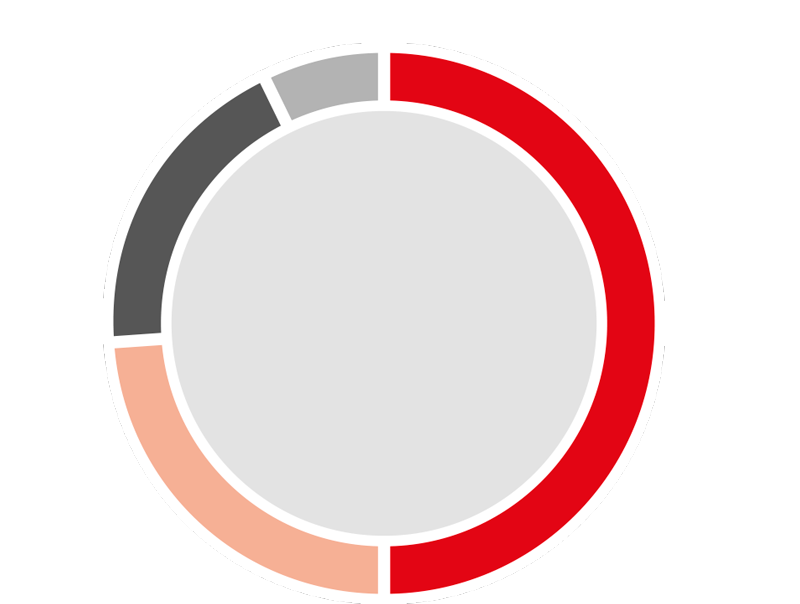
0
stores
50%
of sales 2018
869,059%
sales area (sqm)

0
stores
24%
of sales 2018
255,752%
sales area (sqm)

0
stores
19%
of sales 2018
40,491%
sales area (sqm)

*Includes 2 Boutiques
0
stores
7%
of sales 2018
70,520%
sales area (sqm)
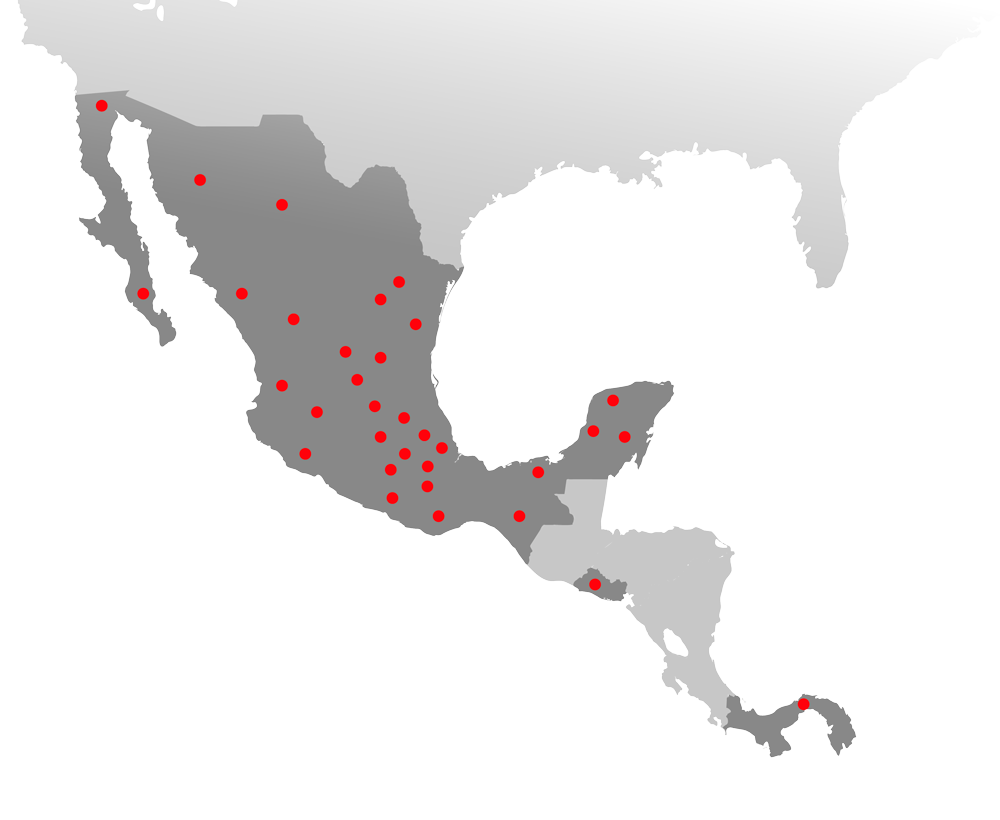
0
cities with presence in the country of our network
of stores.
Sales Breakdown by Subsidiary
(Million pesos)
EBITDA Breakdown by Subsidiary
(Million pesos)
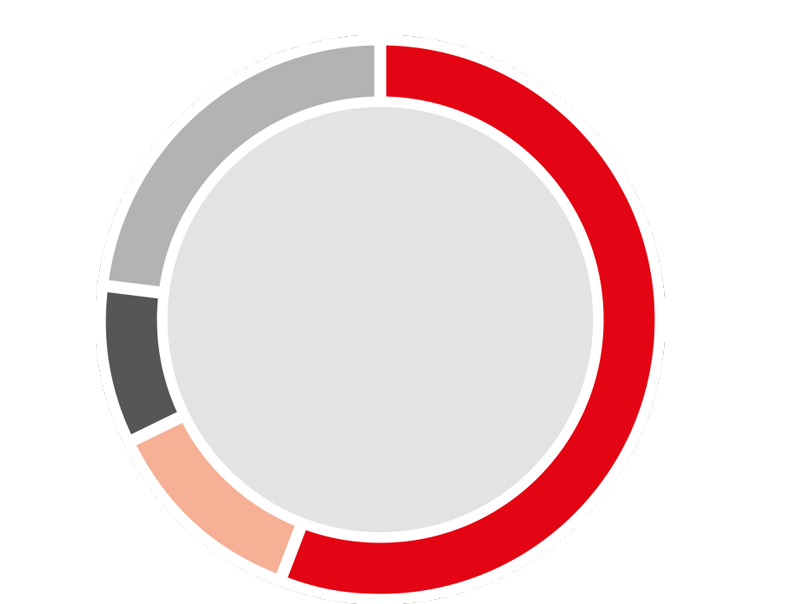
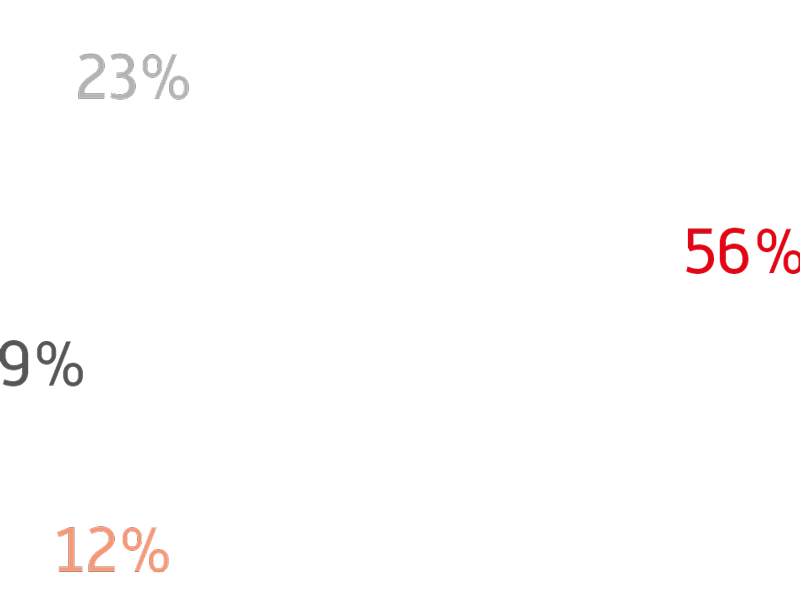
Sears Sanborns Promusa Other
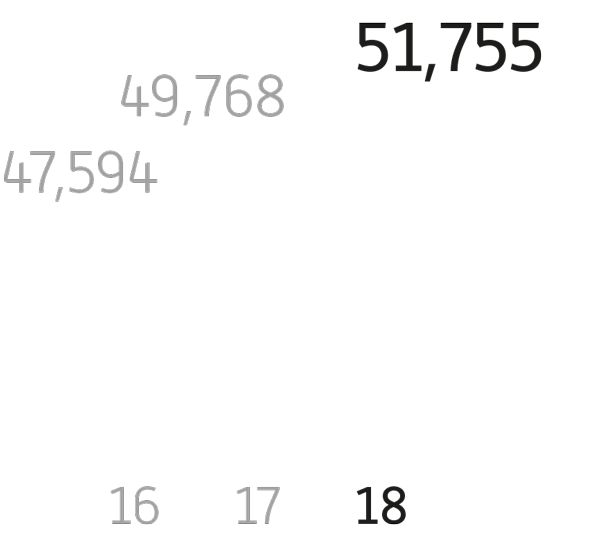
Total Sales
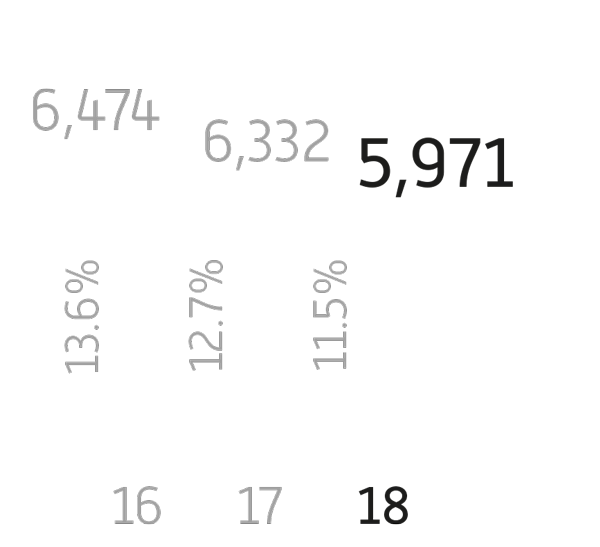
(Million pesos)


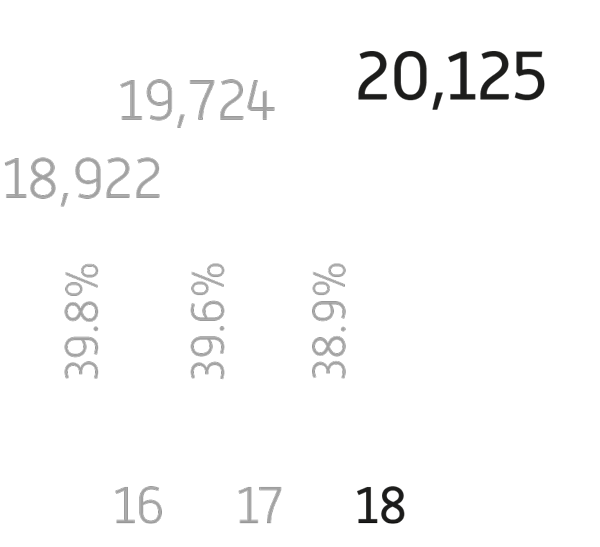
Gross Profit
(Million pesos)
Gross Profit %


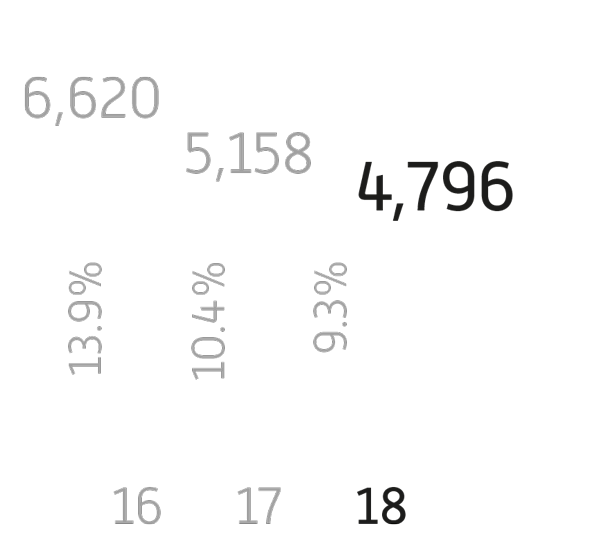
Operating Income
(Million pesos)
Operating Margin %


EBITDA*
(Million pesos)
EBITDA Margin %


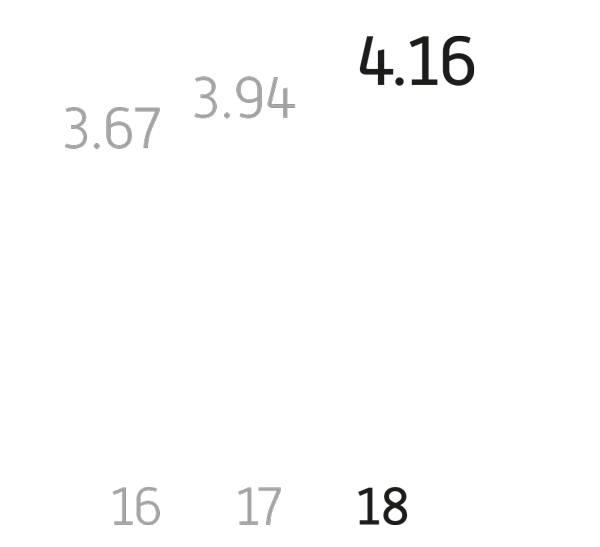
Number of GS
private label cards
(Million cards)


* For 2016, $1,263 million pesos of other income was not considered, where $1,141 million come from the accounting profit from the acquisition of 14.0% in Inmuebles SROM, S.A. of C.V. and $122 million come from the appraisal of investment properties, among other items. For 2017 and 2018, Other Income was not considered for $ 85 million pesos and 115 million pesos from valuation of investment properties and property deterioration, respectively. See reconciliation of EBITDA in Note 27 of the Financial Statements.